

Trace an Agent
1
Install tracing dependencies
2
Configure database export
Call
setup_tracing() once at application startup, before creating agents.tracing_agent.py
3
Query stored traces
setup_tracing(db=...) installs Agno’s DatabaseSpanExporter and instruments agents, teams, and workflows through OpenTelemetry.
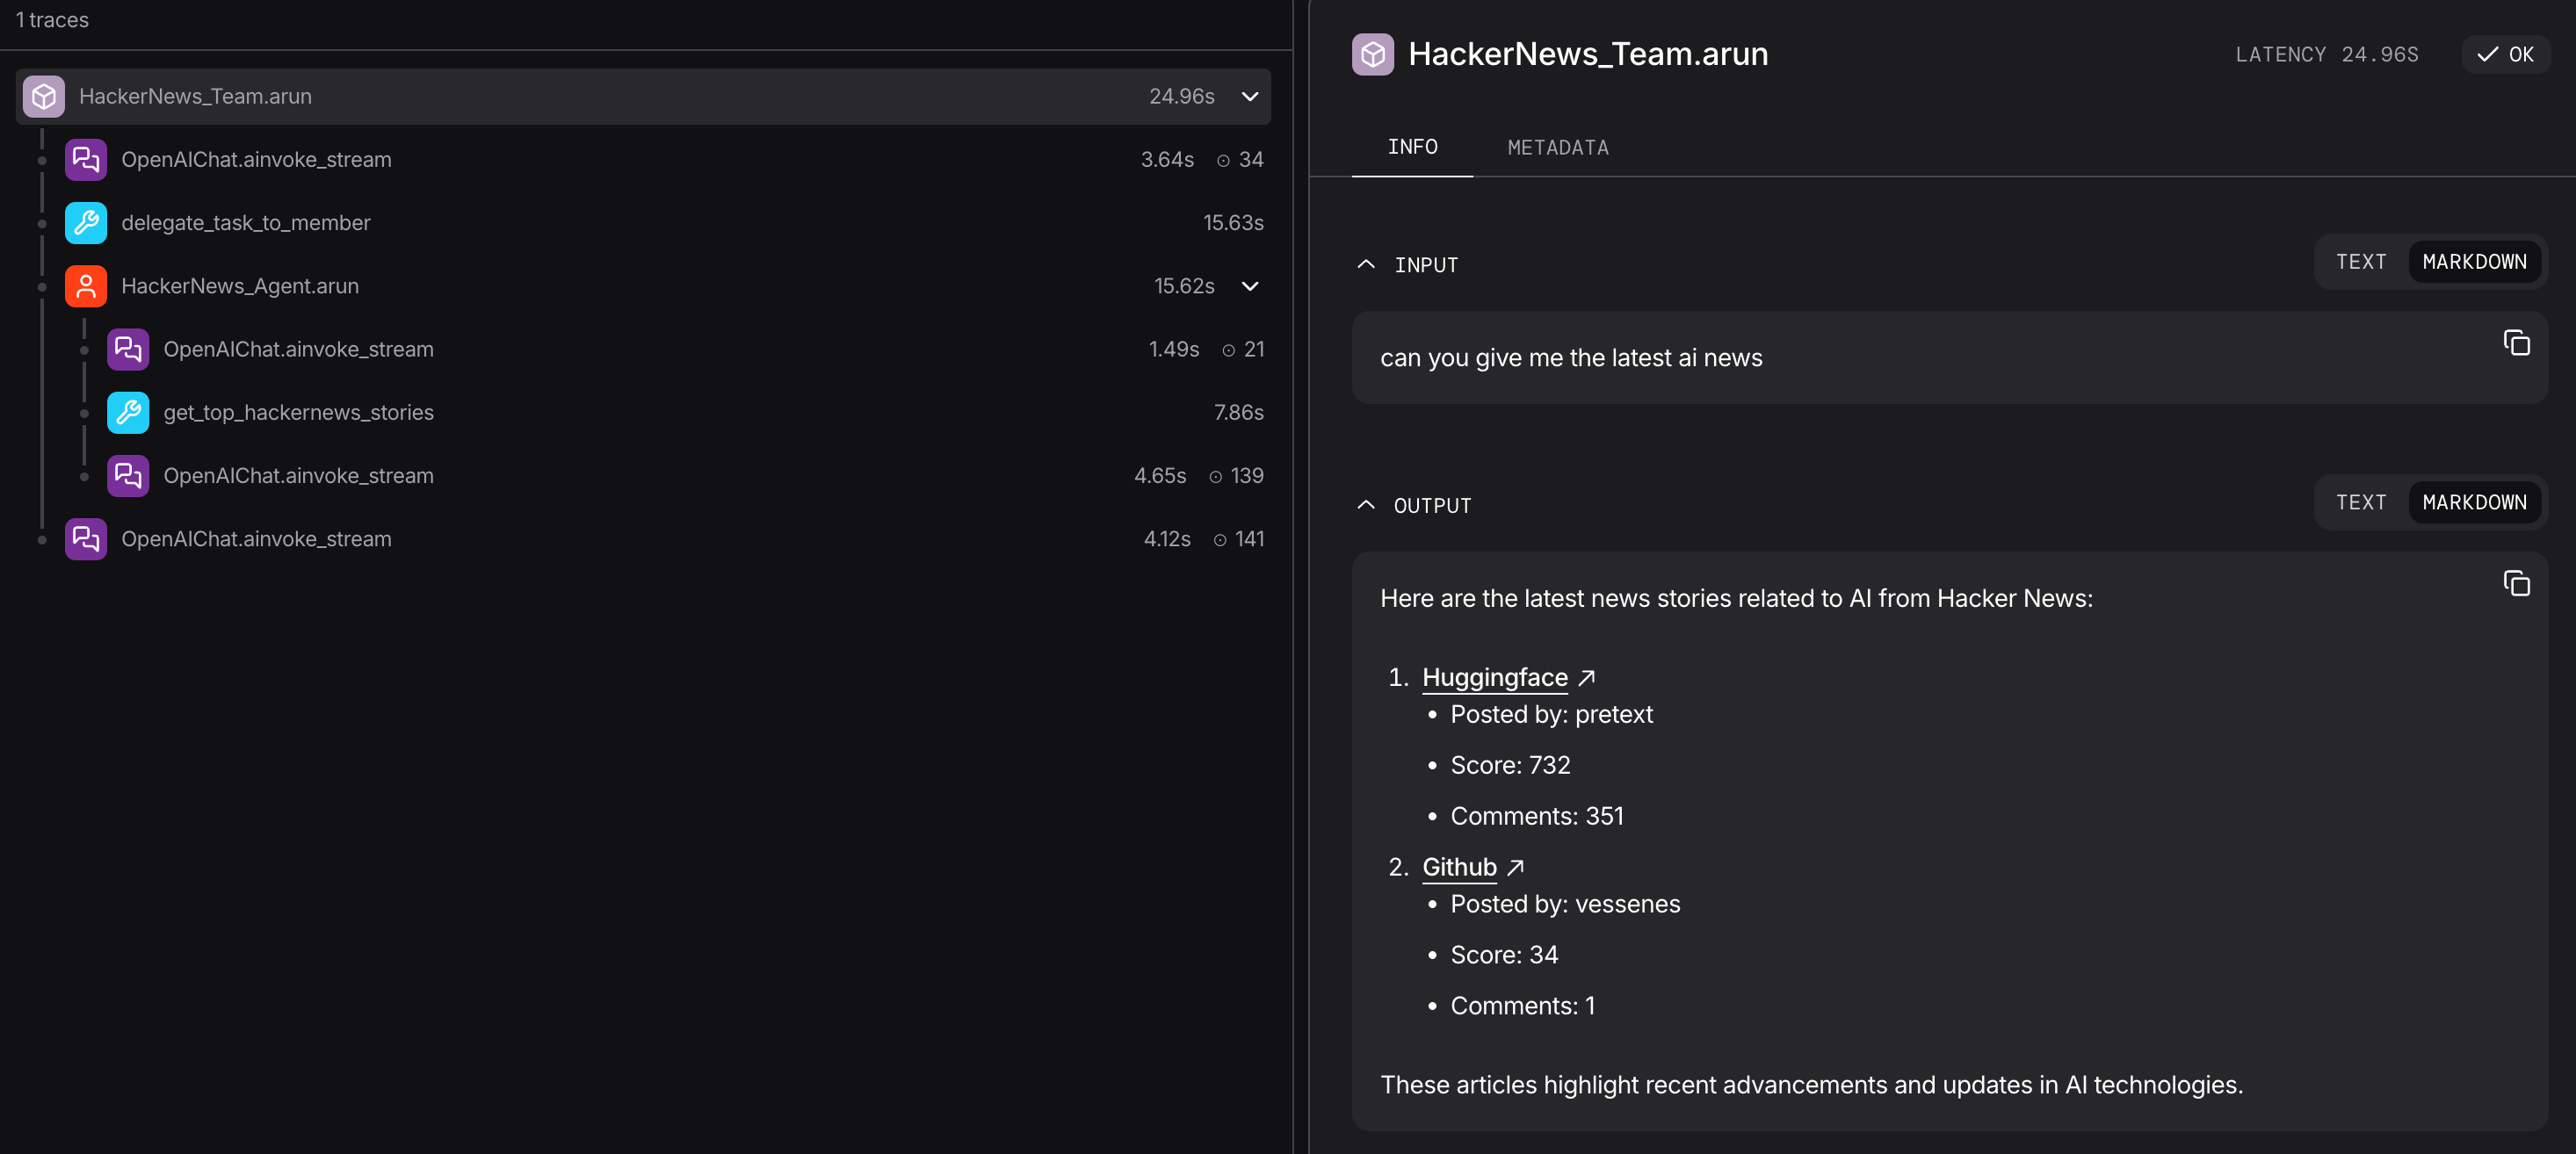
Traces stored in SQLite and viewed in AgentOS
Traces and Spans
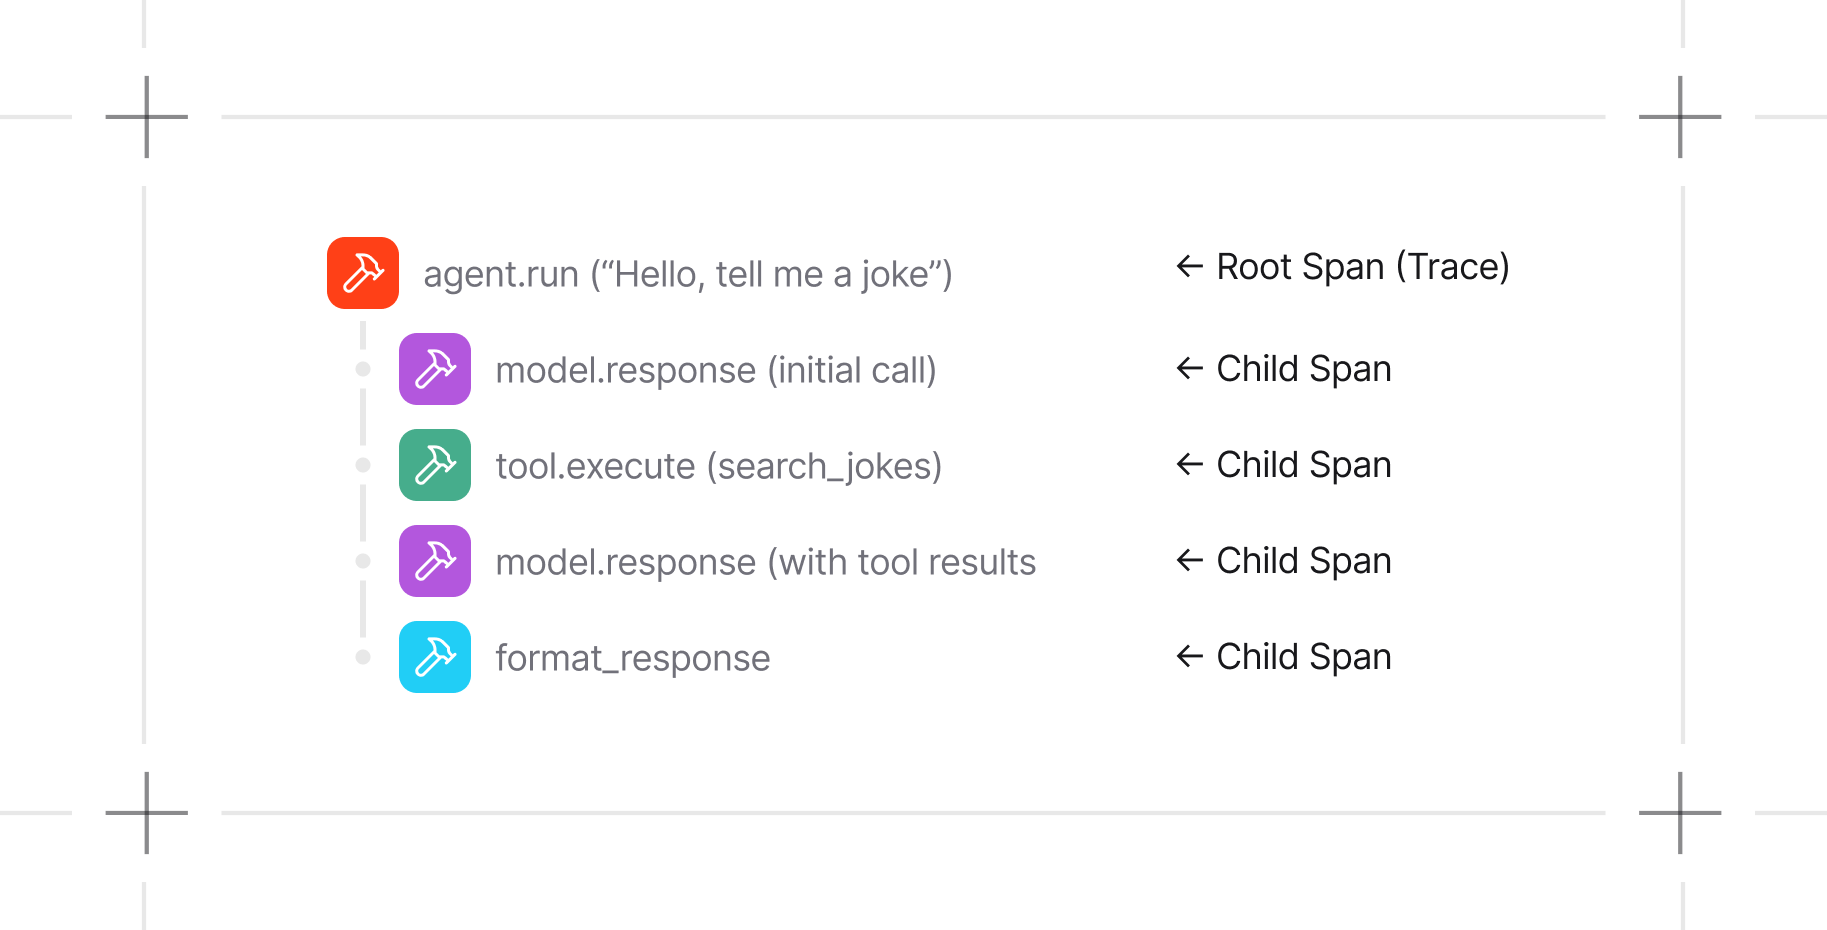
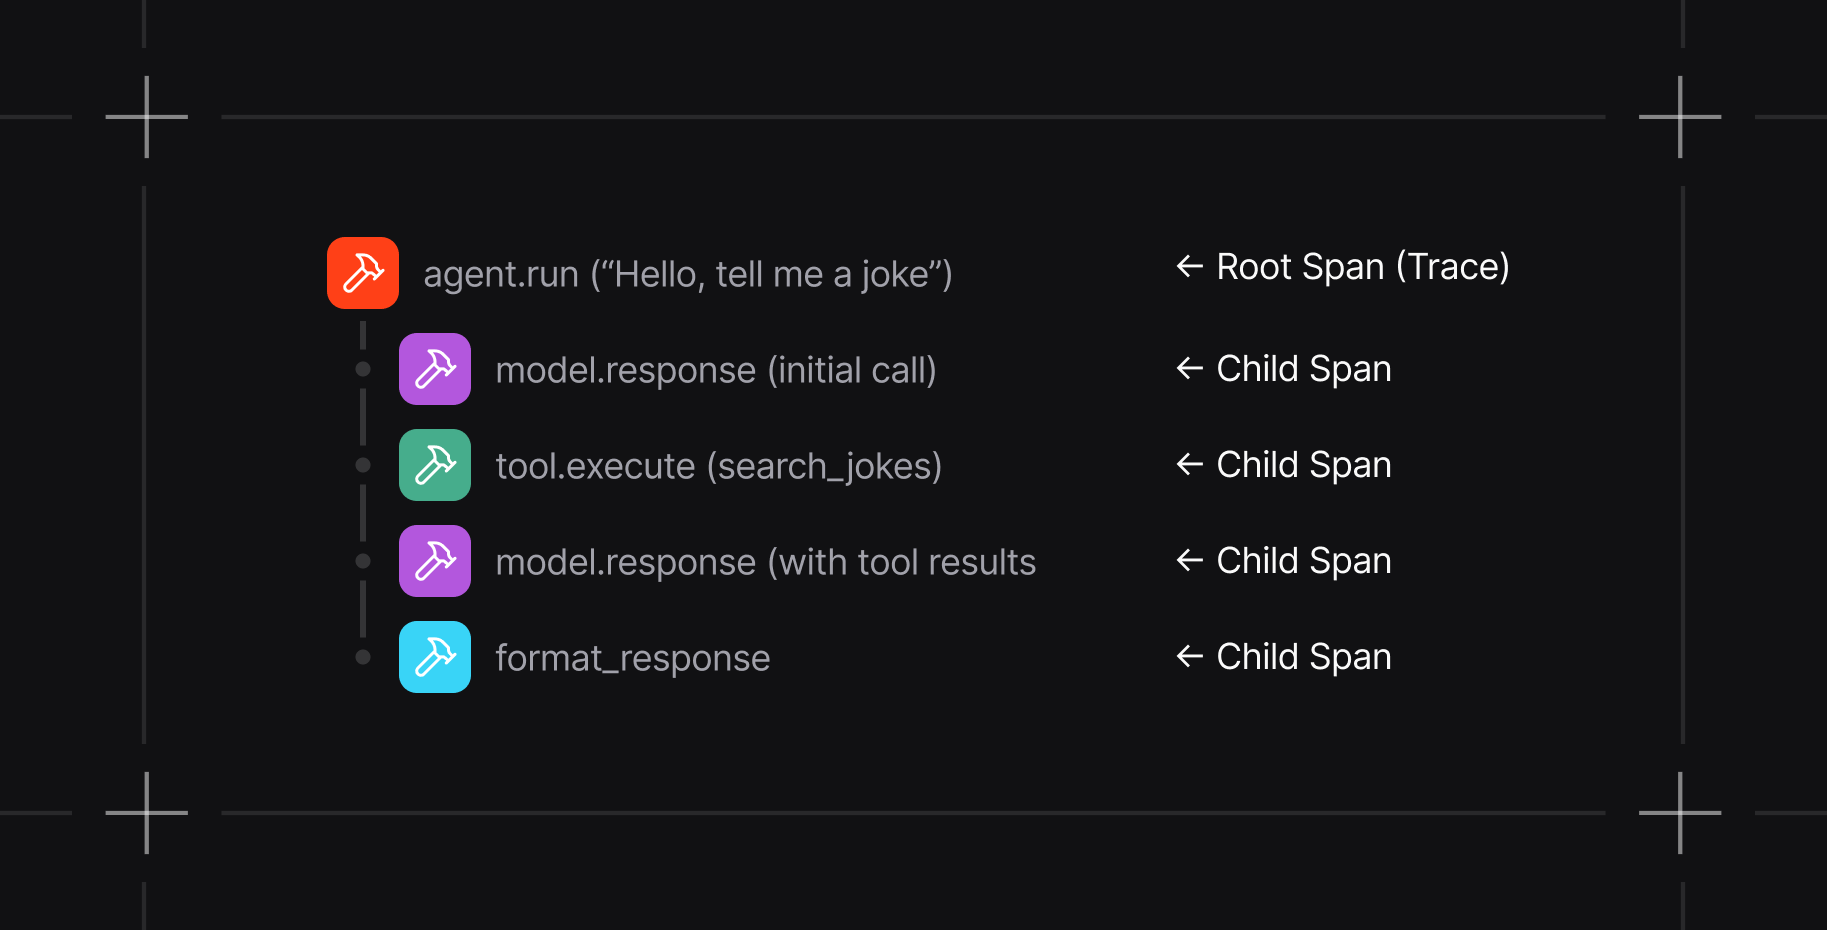
What Gets Traced
Agno instrumentation captures spans for:
Spans carry timing, status, relationships, and operation attributes. Trace payloads can include application inputs and outputs. Review captured attributes before sending traces to a shared or external destination.
Choose a Trace Destination
Tracing storage follows the OpenTelemetry configuration in your application:
Use Agno OpenTelemetry integrations when traces should go to an external observability backend. The exporter configuration determines where those spans are sent.
Immediate and Batch Export
setup_tracing() writes each completed span immediately by default. Set batch_processing=True to queue spans and export them in batches.
Next Steps
Basic Setup
Configure SDK and AgentOS tracing.
Tracing in AgentOS
Store and inspect traces for an AgentOS runtime.
Database Functions
Query traces and spans from an Agno database.